Researching Traffic and Collision Data with AI
Designing and building research tools with to help answer questions about our cases with the help of AI.
QUESTION PRESENTED:
Do AI data center construction sites correlate to higher traffic wrecks around the often rural areas where these sites are located?
SHORT ANSWER:
Yes there is correlation. Local road collisions show an increase in recent years around data center construction sites considered in this research and post. Local road collisions in Potter and Randall County increased by around 20% over the past few years. Data centers are under construction is many rural areas because land is cheaper and local opposition is less likely. These projects may increase commercial vehicle traffic on interstates and especially local roads, possibly leading to an increase in car and truck crashes.
DISCUSSION
I. Area Studied
This analysis is used as an example and limited to Potter and Randall Counties in Amarillo, Texas. I built an interactive map containing the data for seven different data center construction sites around West Texas and New Mexico available at www.datacentertraffic.com.
II. The Results
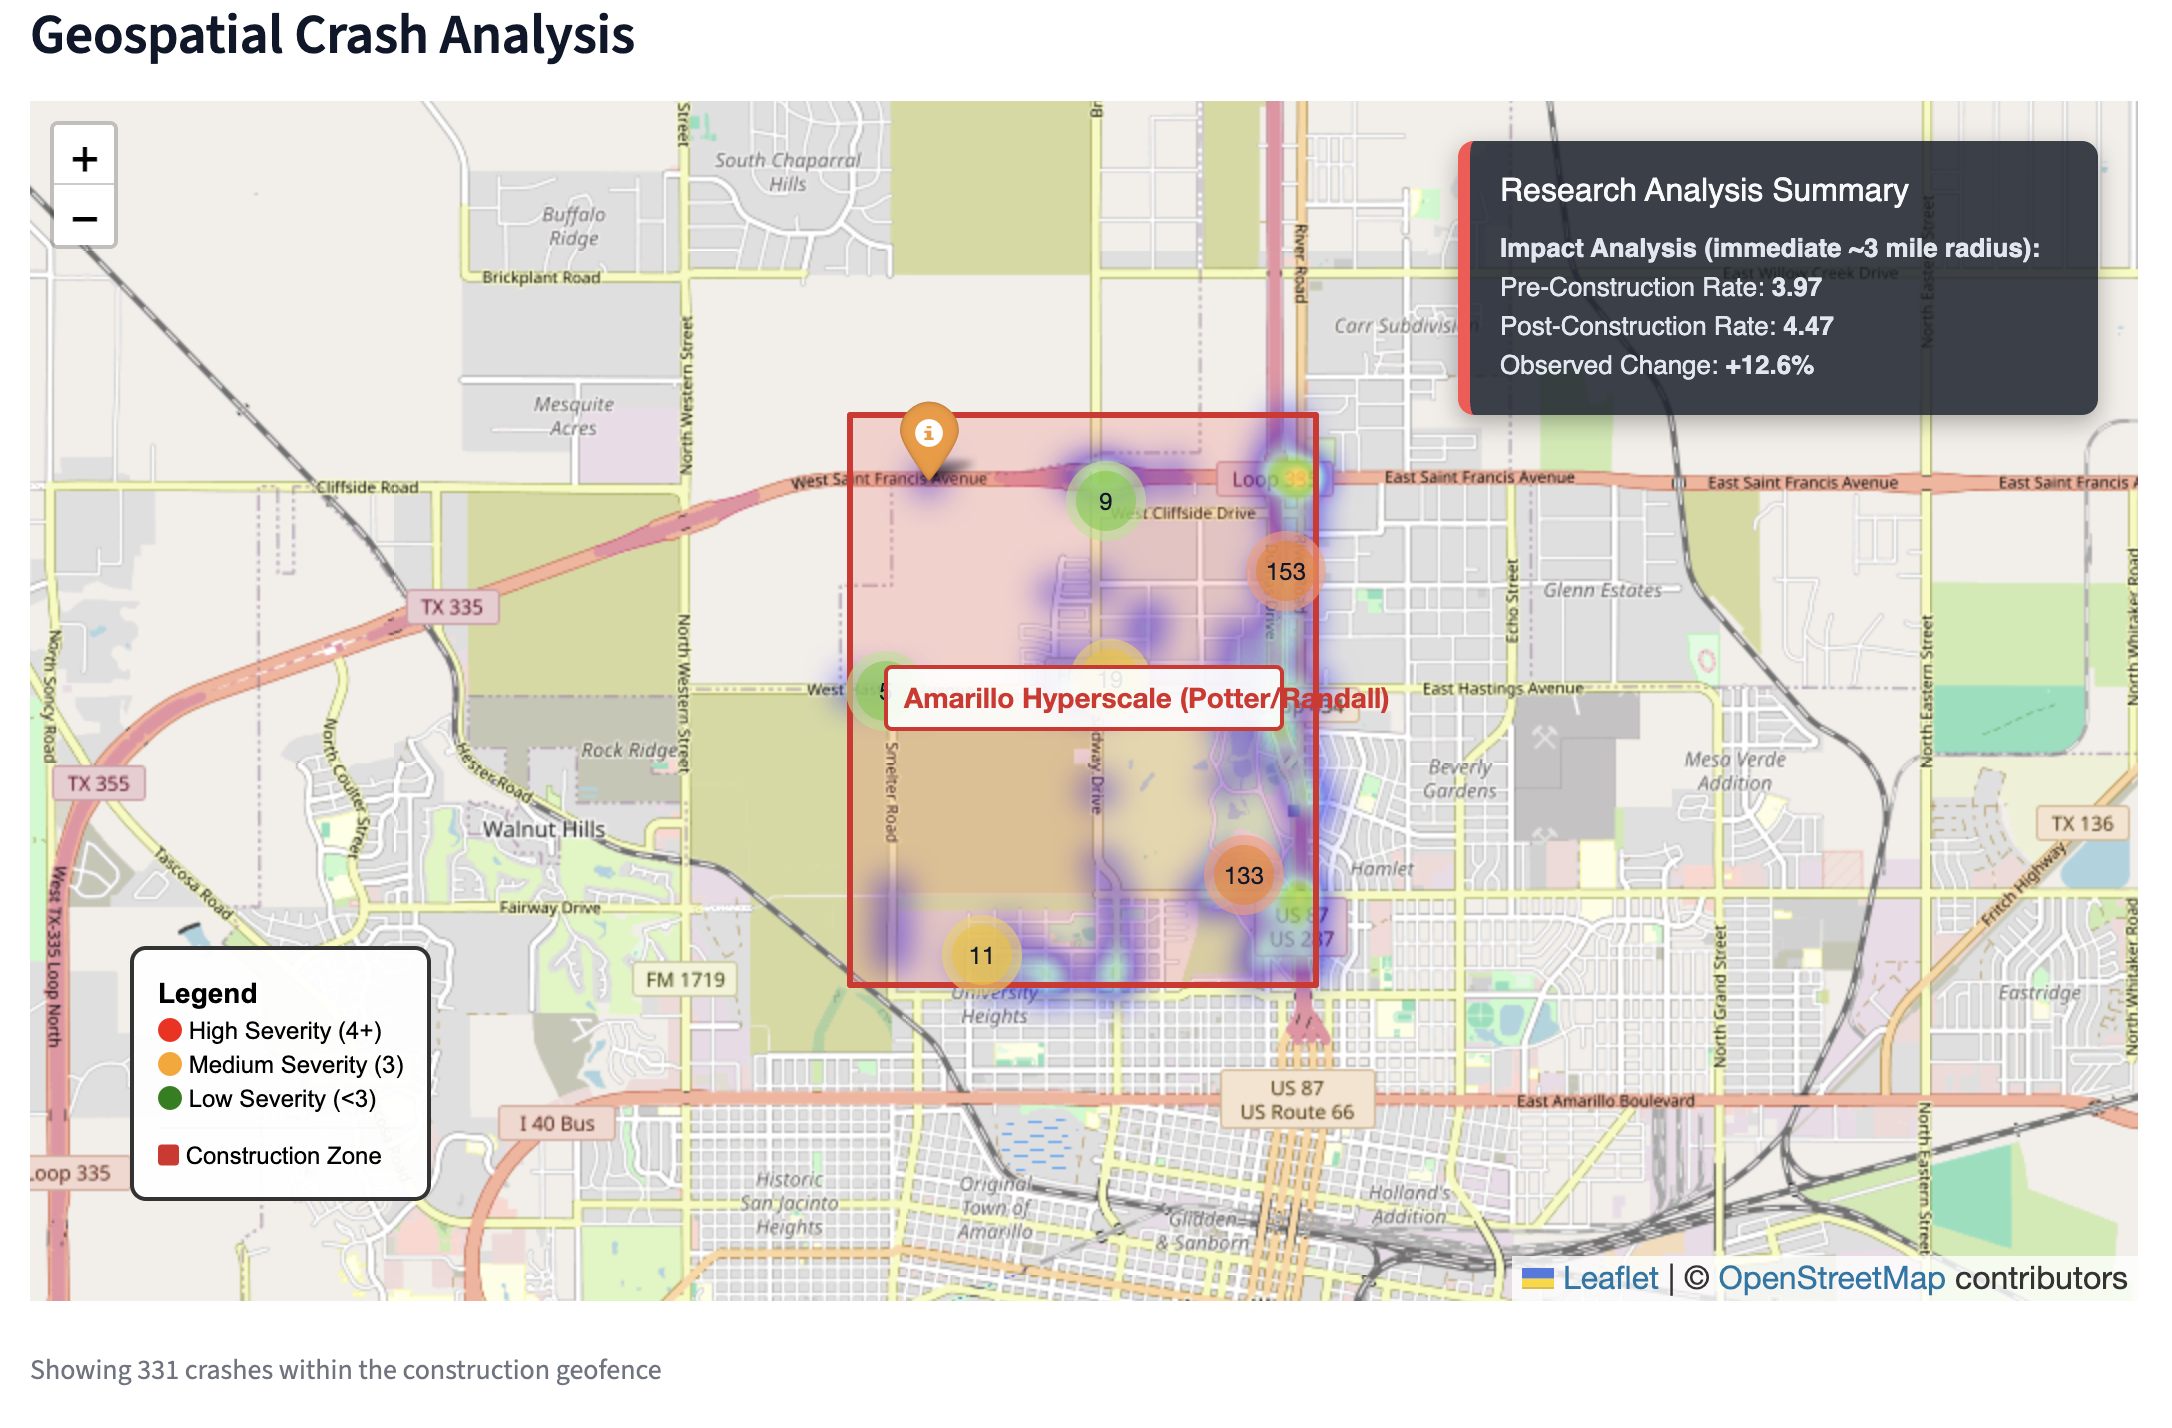
My analysis of the Amarillo Hyperscale Project in Potter County revealed that there is a general increase in local traffic collisions surrounding the construction site.
II. Analysis
I analyzed traffic collision data within the geofenced area (Lat: 35.15-35.25, Lon: -101.9—101.8) of the proposed Amarillo Hyperscale Data Center project in Potter County, Texas. Utilizing TxDOT C.R.I.S. data from 2022-01-01 to 2025-12-23, I identified trends in crash frequency and Commercial Motor Vehicle (CMV) involvement to assess the safety impact of pre-construction and early mobilization activities.
Methodology
Data Ingestion
The analysis utilizes the “Industrial Safety Impact Monitor” dataset, specifically the crashes_manual.csv aggregate which includes:
-
Source: TxDOT Crash Records Information System (C.R.I.S.)
-
Geospatial Scope: Bounded box covering the Amarillo Hyperscale site and immediate access corridors.
-
Timeframe: 2022 - 2025
-
Total Records: 9285
Analysis Performed
-
Geospatial Filtering: Crashes were isolated to the project’s specific coordinate bounding box.
-
Temporal Aggregation: Incident frequency was analyzed on a monthly and yearly basis to detect inflection points coinciding with project timelines.
-
Severity Classification: Incidents were categorized by CMV involvement to isolate risks associated with heavy construction logistics.
Results
A total of 9285 crashes were recorded in the study area.
Yearly breakdown:
-
2022: 2370 crashes
-
2023: 2012 crashes
-
2024: 2573 crashes
-
2025: 2330 crashes
Commercial Vehicle (CMV) Involvement
Of the total incidents, 269 (2.9%) involved commercial vehicles. This metric is critical as CMV accidents often have higher severity due to vehicle mass.
Trend Over Time
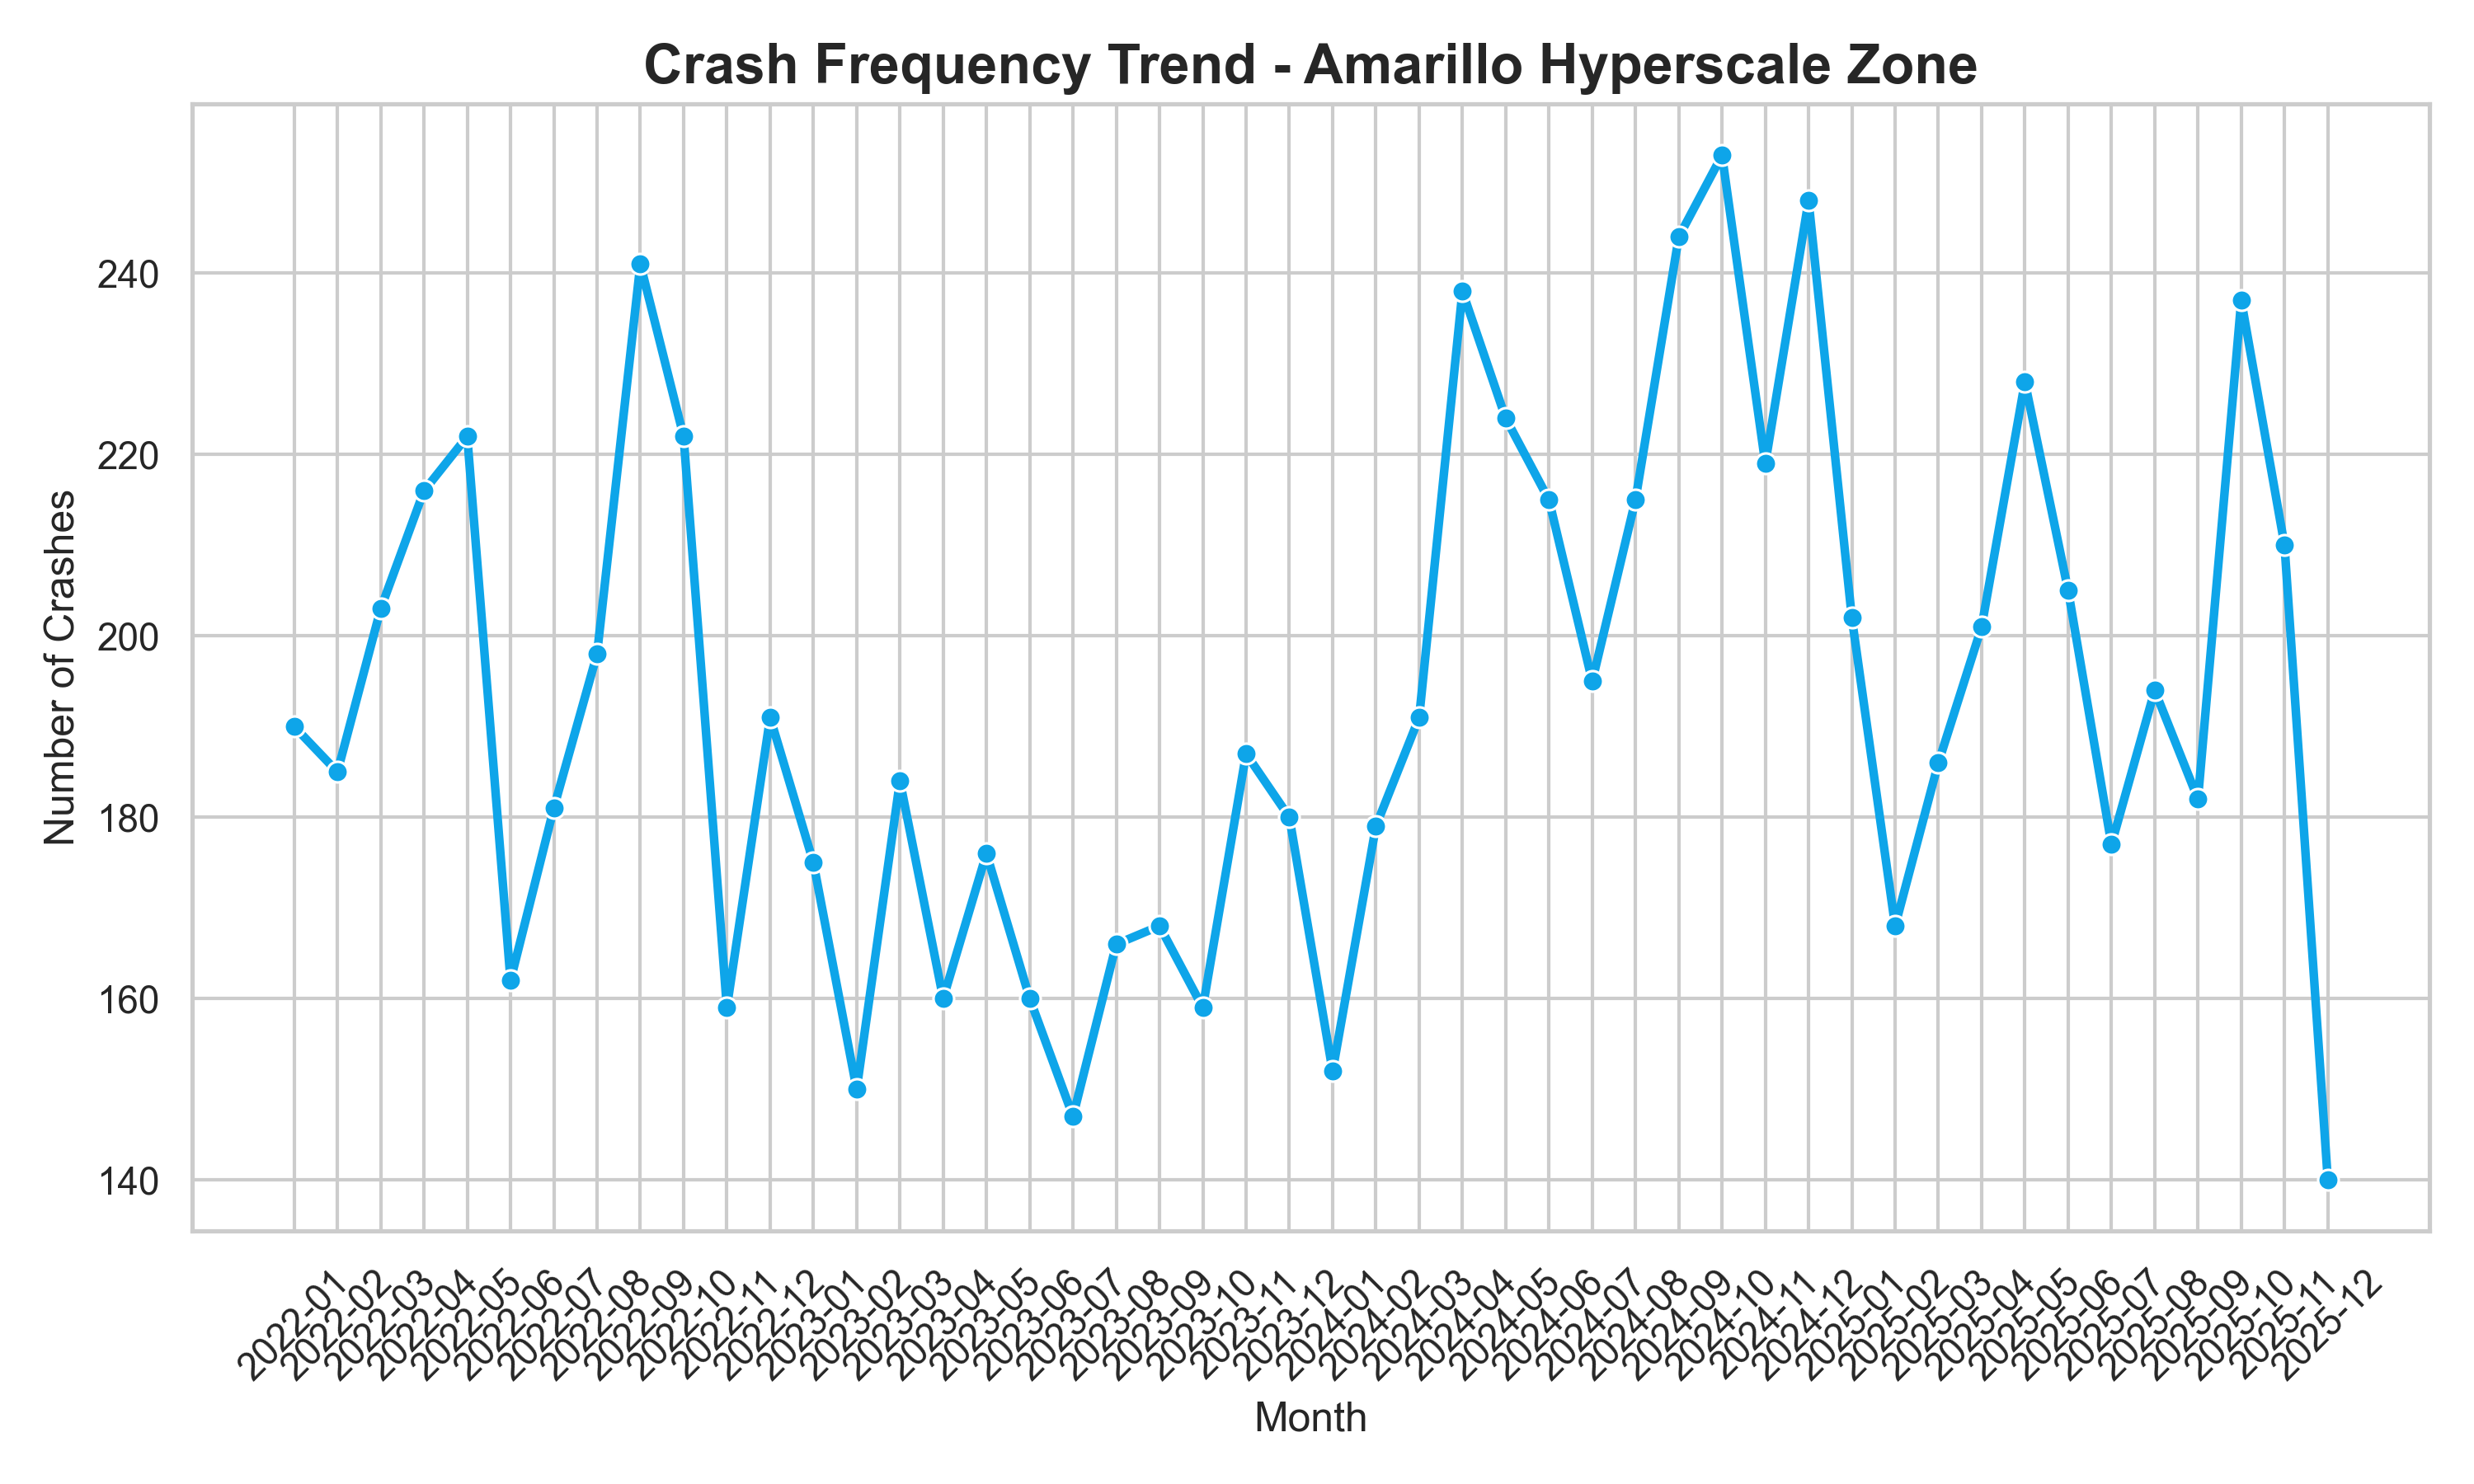
The data indicates a complex trend over the 2022-2025 period. While the overall volume shows a slight decrease (-1.7%) comparing 2025 to 2022, there was a significant 27.8% surge in crashes in 2024 (2,573 incidents) compared to the previous year (2,012). The CMV involvement rate of 2.9% (269 incidents) suggests a baseline of heavy traffic in the corridor.